1 Overview of Releases and Transfers in North America, 2014–2018
1.1 Facilities Reporting to the North American PRTRs
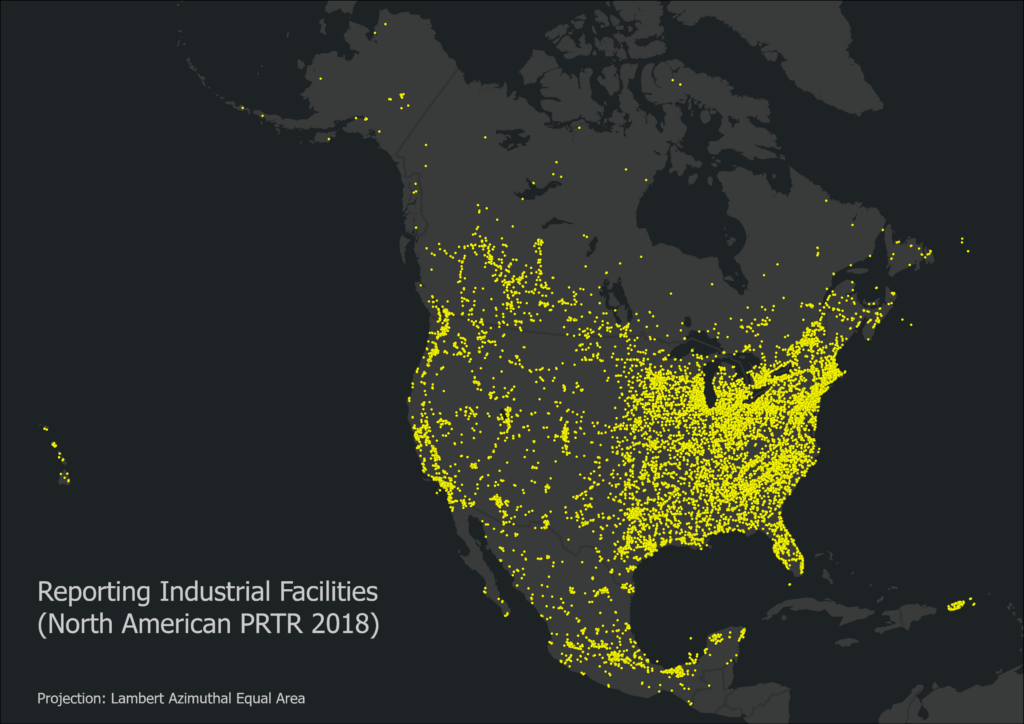
Figure 3 shows the distribution of industrial facilities reporting pollutant releases and transfers to the three PRTR programs in 2018.[2]
Figure 3. Facilities Reporting to the North American PRTRs, 2018

Note: While the map shows almost 30,000 facilities reporting to PRTR systems in North America, certain facilities in Canada and Mexico are excluded from the Taking Stock Online database due to different national reporting requirements for greenhouse gases and criteria air contaminants. Readers are reminded that differences among national reporting requirements need to be considered when interpreting North American PRTR data.
While all facilities reporting to the PRTRs in 2018 are presented on this map, more than half of those reporting to Canada’s NPRI and almost one-third of the facilities reporting to Mexico’s RETC are not included in this report and the Taking Stock Online database because they reported only emissions of criteria air contaminants (CAC) or greenhouse gases (GHG), two groups of pollutants for which national PRTR reporting requirements differ. As explained in “Understanding Taking Stock” (www.cec.org/takingstock), each PRTR program features a unique list of pollutants (or pollutant groups) subject to reporting: Canada’s NPRI has over 320 substances, Mexico’s RETC covers 200, and the US TRI includes more than 700. Approximately 70 pollutants (or pollutant groups) are common to all three countries.
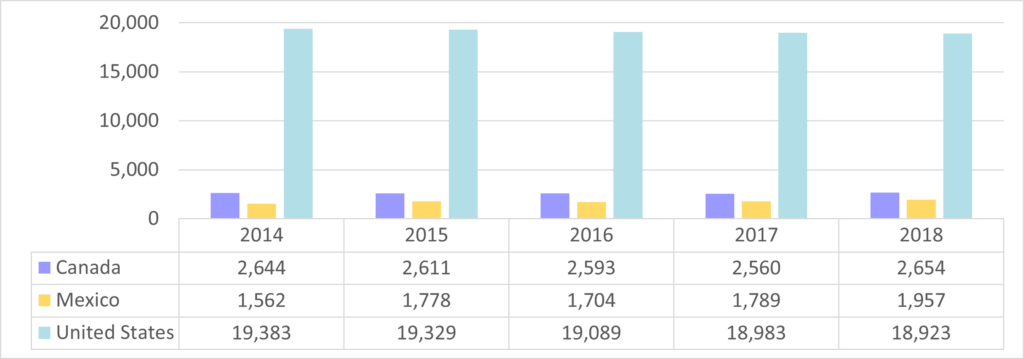
Figure 4 shows the change in the number of North American facilities reporting between 2014 and 2018. It reveals that the number of facilities in Canada and the United States did not change significantly over this period.
Figure 4. Number of Reporting Facilities in North America, 2014–2018
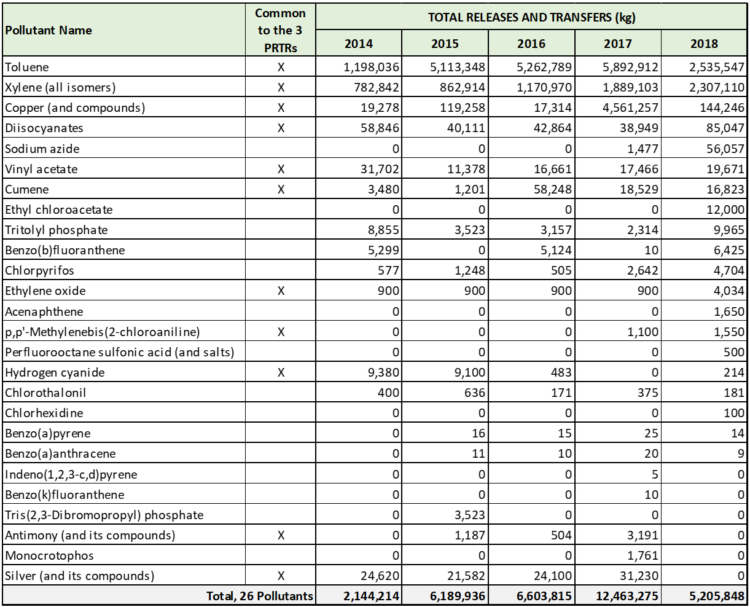
In Mexico, however, the number of reporting facilities increased by approximately 25%, from 1,562 in 2014 to 1,957 in 2018. A reason for this increase appears to be the change in RETC reporting requirements that came into force in 2014, when the list of substances subject to reporting expanded to 200 pollutants from the original 104. As shown in Table 1, 26 of these new substances were reported by Mexican facilities between 2014 and 2018, resulting in an addition of between 2 million and more than 12 million kg in total releases and transfers each year. Toluene and xylenes accounted for well over 90% of the annual totals and were reported by facilities in a wide number of sectors (e.g., rubber products manufacturing, motor vehicle parts manufacturing, paints, coatings and adhesives manufacturing, basic chemicals manufacturing).
[2] The 2018 reporting year was selected to illustrate the locations of recently reporting facilities. Each year, a certain number of facilities in each country report no releases or transfers (for example, if they do not meet pollutant reporting thresholds); therefore, the facilities included in the data analyses in this report are those that reported at least 0.0001 kg in total releases and transfers.

