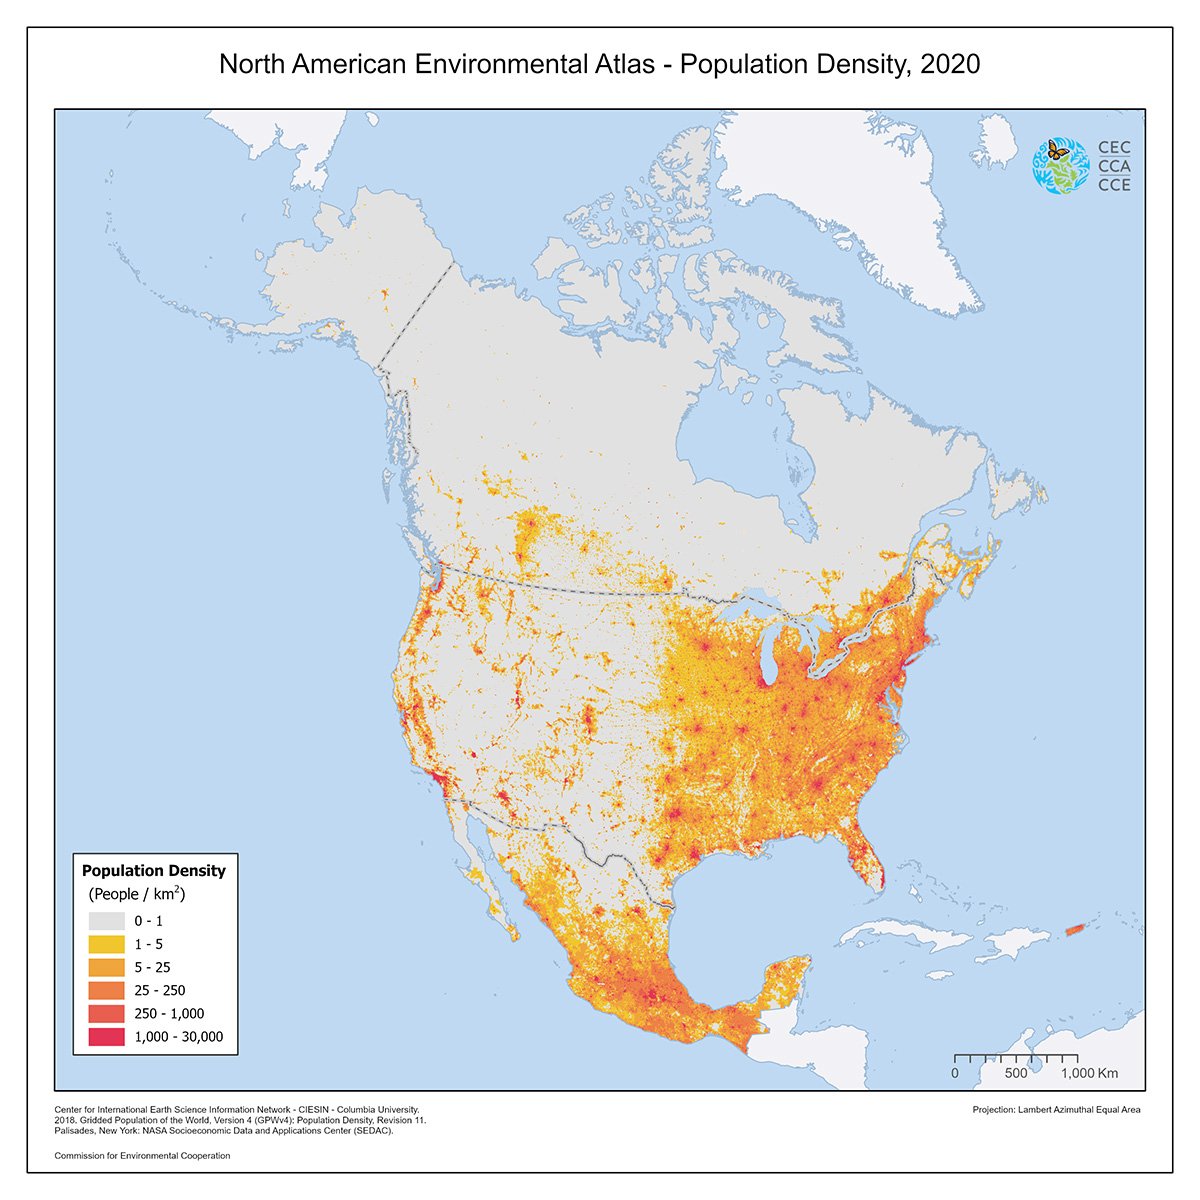
Population Density, 2020
Map type: Human Influence
This map shows the population density of North America for the year 2020 in number of people per square kilometer within 2.5 arc-minute pixels.
The dataset is derived from the Gridded Population of the World, Version 4 (GPWv4), produced by the Center for International Earth Science Information Network (CIESIN) from Columbia University in 2018.
Source: Center for International Earth Science Information Network (CIESIN) - Columbia University. 2018. Gridded Population of the World, Version 4 (GPWv4): Population Density, Revision 11. Palisades, New York: NASA Socioeconomic Data and Applications Center (SEDAC). Available at https://doi.org/10.7927/H49C6VHW. (consulted in October 2022)

Contact
Questions about the North American Environmental Atlas? Contact:
Dominique Croteau
Project Lead, Geospatial and Environmental Information